Power BI
Microsoft Power BI for Office 365 is a cloud-based collection of new features and services that, together, enable you to visualize data, share discoveries, and collaborate in intuitive new ways. Power BI helps you build on your existing knowledge of Excel, amplifying your ability to understand and capitalize on the ever-expanding world of valuable, yet sometimes unwieldy, data.
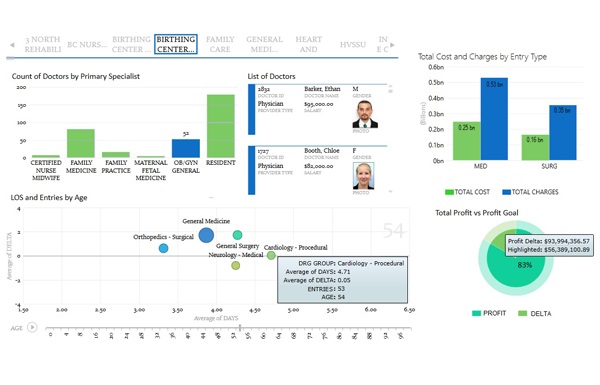
A sample report for a Manufacturing company *
Share your BI solutions
With both Excel and Power BI for Office 365, you can give everyone in your organization a powerful new way to work with data. In Excel, you can now discover, analyze, and visualize data like never before to find valuable business insights. With Power BI for Office 365 you can easily deploy a cloud-based BI environment for users to share insights, collaborate and access reports, from anywhere on any device.
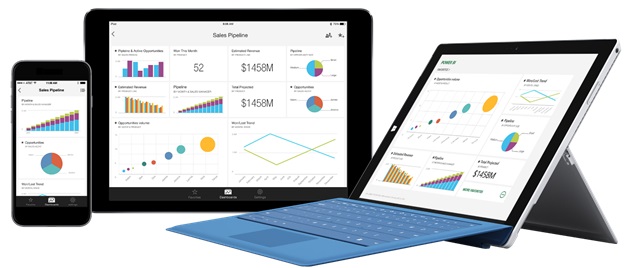
Cross platform access **
BI solution within Excel
Using Excel and Power BI, we help you take the next step to discover, analyze and visualize your data effectively. We enhance your already built excel reports with strong features making your reports interactive and dynamic.
These features are part of the familiar Excel environment, and extend its functionality to all sorts of cool data-specific capabilities. We help you to create content (such as workbooks, data models, and visualizations) that can be published and shared in Power BI for Office 365. Some of these BI features in Excel have been available before, some are new, but each is now integrated into Excel.
These client tools are:
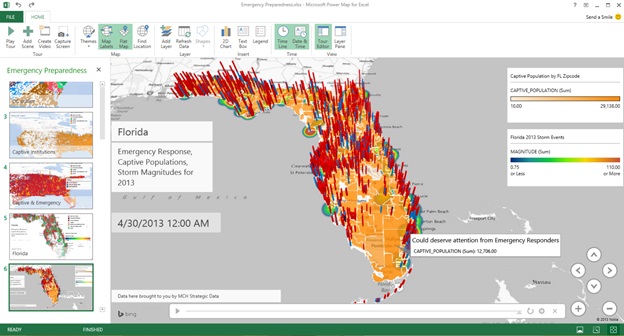
sample geo-report for a government project ***
Power Query
We help you discover and connect to data from public and corporate data sources. This includes new data search capabilities, as well as capabilities to easily transform and merge data from multiple data sources so that you can continue to analyze it in Excel.
Power Pivot
We help you create sophisticated data models with that data in Excel by creating relationships, custom measures, hierarchies, and KPI‘s. Power Pivot models run in-memory so that users can analyze 100‘s of millions of rows of data with lightning fast performance.
Power View
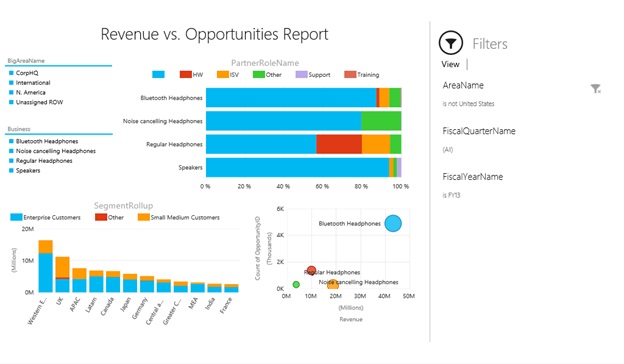
We create reports and analytical views through interactive charts and graphs that help you explore and present your data visually in Excel.
Power Map
We provide you with geo-reports where you can explore and navigate geospatial data on a 3D map experience in Excel.
Power BI for Office 365
Insights and visualizations are better when shared. Through Power BI sites, we make insights available to everyone in your organization in a secured fashion, enabling your users to access the reports anywhere anytime:
Power BI Sites
This is the heart of your collaborative Power BI experience. We create Power BI sites for your team to share and view reports. Larger workbook viewing is also supported (up to 250MB) so that users can view and interact with larger workbooks through the browser.
Data Management
With the data management features of Power BI, not only can you share your own query-creating genius, you can find other queries easily, too. You‘re collaborating from within Excel, and sharing it online.
Power BI for Windows
See the latest reports posted to your Power BI site from a rich, immersive app on your mobile device.